I’m back at work but the question of public preferences on parental leave hasn’t left me. I’m lucky I was able to switch to a 4-day workweek which means I’ve been trying to use my fifth workday to dig deeper into the topic (in-between laundry, chores and daycare bugs).
I once again used the amazing data-set from the International Social Survey Program (ISSP) which includes almost 30,000 respondents across 22 countries. The survey was run in 2021. I focused on a question where survey respondents were asked to consider a couple both of whom work full-time and have a newborn baby. Respondents were then asked:
One of them stops working for some time to care for their child. Do you think there
should be paid leave and, if so, for how long?
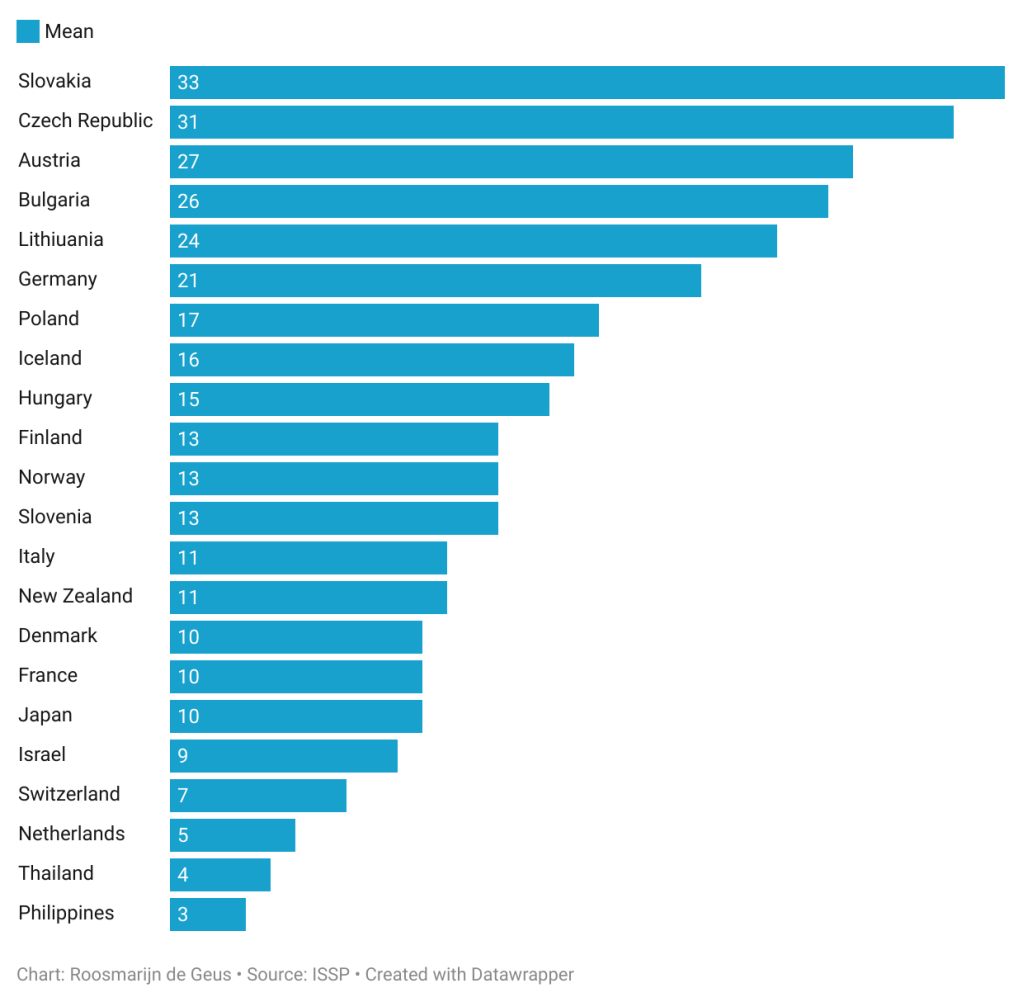
First – overall support for the provision of paid leave is high: 95% of respondents support the availability of paid leave for new parents. Out of the countries in the sample, support is the highest in Lithuania, Norway and Poland and lowest in the Philippines, Hungary and (yes really!) – my native country of the Netherlands, where only 71% of respondents supported paid leave.
Second – when considering how long this paid parental leave should be we see a huge amount of variation among respondents. This is definitely not a topic that people readily agree on. The average leave suggested across all countries and all respondents is 13.6 months, but the standard deviation is 12 months(!) so there really is a lot of variation here. The median is 12 months. I have yet to compare these suggested lengths of leave with actual leave provisions, but it’s safe to say there is a gap between existing leave provisions and people’s desires as has been reported elsewhere.
Figure 1 – Mean length of suggested leave in months per country
Gender differences in leave preferences
Now – one thing we might expect is that women support longer leave periods. Why? First, because women in general tend to be more supportive of welfare provisions and we may expect this to include parental leave. Second, we can speculate that women might be slightly more aware of the physical toll involved in giving birth and the emotional rollercoaster that is postpartum – either based on their own experience or because of exposure to friends or family who have given birth. We see this gender difference born out in the data – though I have to admit it is smaller than I thought.
Figure 2 below shows the suggested leave period (in months) for male and female respondents across countries. In several countries (Austria, Bulgaria, Israel, Slovenia, Thailand) men and women think very similarly about the appropriate length of parental leave and estimates are statistically indistinguishable.
In some other countries (Denmark, Finland, France, Hungary, Iceland, Norway, Japan and Lithuania) differences are much larger. This is an interesting set of countries as it includes some real “gender equality” powerhouses. I’m not sure (yet) why this pattern might exist and whether it withstands more rigorous testing. Some research I’ve been reading has shown the nuanced relationship between gender equality norms and parental leave preferences (Kauffman et al. 2023). These authors find for instance that those with gender egalitarian views support shorter leaves for women as they have an overall desire for smaller gaps between paternity and maternity leaves. Also – those who support women’s financial independence and autonomy may favour shorter leaves for women. In the survey question used here however I cannot distinguish whether respondents were thinking about mothers or fathers when suggesting the preferred length of parental leave.
In general though – men and women don’t seem to differ hugely in their ideas about the appropriate length of parental leave for new parents.
Figure 2: Suggested leave period in months (men vs. women)
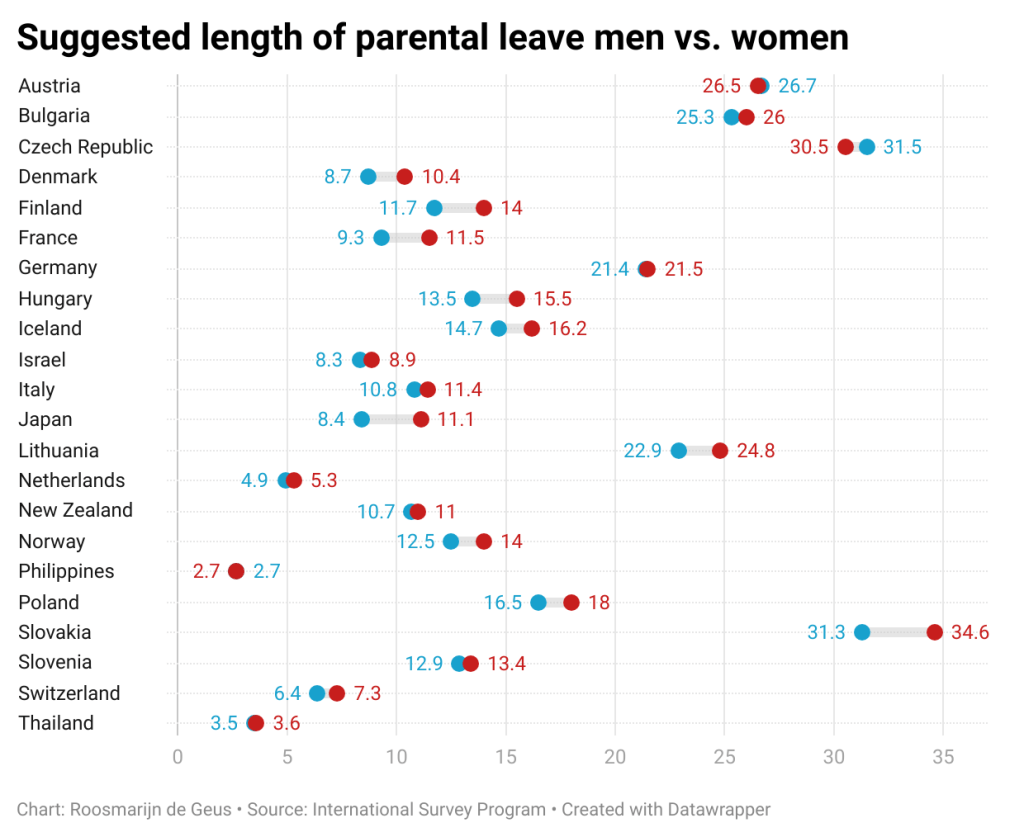
Blue = men ; red = women.
Who takes care of the baby?
Now – once the baby is there – who should take this parental leave? Respondents were asked to think about the same couple and assume they are in a similar work situation with eligibility for paid leave – how should this paid leave period be divided between the mother and father?
Respondents could choose between only mother, only father, majority mother; majority father or half and half. They could also say they didn’t know. There is a lot of agreement across people. The most popular choices were “half & half” (38% of sample) and “mother most – father some” (38%). The third most chosen option is the most gender traditional option whereby the mother takes all the leave – this was supported by 17% of respondents.
Again there isn’t a very clear gender difference in these preferences; across the sample 38% of men and 39% of women opted for a 50-50 split of leave and for both men and women the second and third most popular options included more leave for women than for men or the woman taking the entirety of the leave.
The relatively high levels of support for an equal split are interesting and indicate a clear gap in existing policy provisions. A recent OECD report for instance states that paid leave earmarked for mothers averages 25.4 weeks compared to 12.7 weeks of leave earmarked for fathers. These numbers suggest a big gap between public preferences on leave duration and division and existing provisions.
Figure 3: Preferences on divisions of parental leave
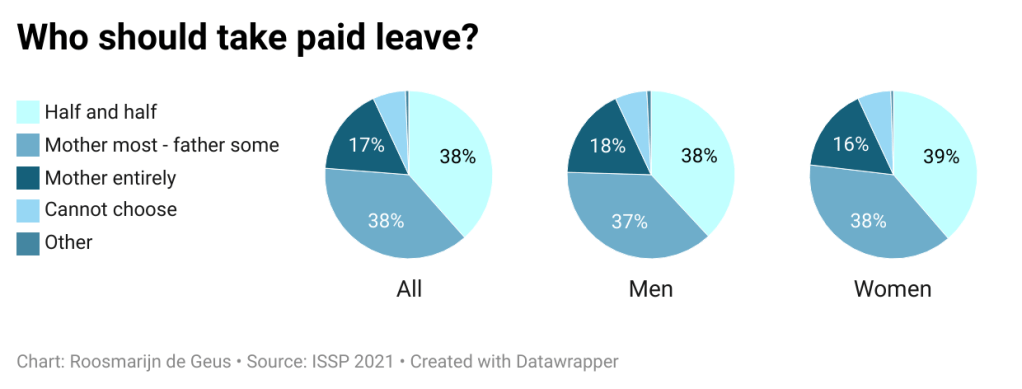
Note the category “other” includes the options “father only” and “father most – mother some” but these options were chosen by fewer than 1% of respondents
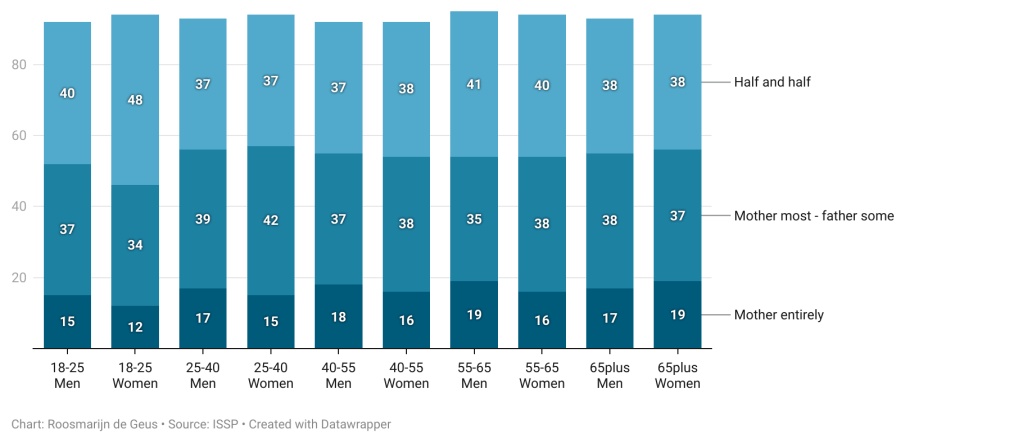
Finally – I had a quick look across generations as I wondered whether these gender-equal attitudes on child rearing are more common among the younger generation. This is borne out somewhat – the level of support for a 50-50 split of parental leave is about 6 percentage points higher among the youngest age group (18-25) compared to all other generations. The second most preferred option across generations remains the ‘’majority mother’’ option.
Figure 4 – Leave division across generations

Interestingly, when looking at age and gender simultaneously it becomes apparent that the group that most strongly prefers gender equal leave taking are young women in the ages 18-25. It is in this group that the gender difference is in fact quite large. This aligns with a general trend that has found increasing differences in views on gender equality among gen z, as well as increasing differences in voting behaviour between young men and women.
Figure 5 – Age and gender gaps in parental leave division preferences
Conclusion
This first dive in the data has provided a few noteworthy patterns and insights. First, overall support for parental leave is high and the suggested duration is significantly higher than is currently available. Second – there are generally high levels of support for leave provisions for men. Here there is an even larger gap between preferences and policy.
Finally – this initial analysis suggests that men and women hold relatively similar attitudes toward parental leave – at least (and this is a big caveat) on average. It will be interesting to explore gender-age gaps and to look at intersections with education and income. But, in previous research my co-authors and I have similarly found that sexist attitudes differ more along political lines than they do along gender lines. In other words – a conservative man and woman are more similar in the way they look at gender roles than two women who support different parties. Parental leave preferences – and preferences on child rearing more generally – may be similar in this regard.

Leave a comment